Residential Home Prices in USA: What Will Decide the Next Decade
What factors are going to affect the residential homes market in the USA in the coming decade? A quick look.

Buying and selling residential property in the US is an important factor for the USA economy overall, as historically seen in the recession of 2008, brought about by a bust in the housing market. Thus, which way the housing market goes carries immense weight right now. Conversely, the housing market is also affected by numerous macro- and micro-economic factors. Different combinations of effects of these factors will decide which way the price of residential homes will turn in the next few months, years and decade.
The residential homes market in the USA can be seen through many different lenses:
- Rural Vs Urban trends.
- Low Income, Median Income & Luxury Housing trends.
- Micro trend vs Macro trend - in terms of localized trends vs trend for the country as well as trends for the next few weeks vs next few years.
All of these are different methods to analyze the same problem: predicting pricing trends for the housing market. A discussion of macro-economic trends gives a holistic, zoomed out understanding of the market, whereas a focus on the micro-factors gives a closer-to-the-ground picture of the market. Both of these perspectives matter for predictive pricing for the housing market.
Housing market is affected in complex ways by many factors, which are often inter-related themselves. Many of these factors operate on a macro as well as local level, and the trend may or may not be the same on country level and neighbourhood level. Both need to be considered when looking at predictive pricing for residential homes.
Supply and Demand of Residential Homes
For how long homes remain listed is an indicator of the supply and demand in the housing market. The inventory or the 'months of supply' is the metric used to assess whether it is a buyer's market or a seller's market. Shifts in demand or supply of homes reflects in the months of supply. If, for eg, for a city/neighbourhood, 100 homes are sold per month, then a listing of 600 homes indicates a supply of 6 months. As a yardstick, 6 months of supply is usually considered a 'balanced' market. Less than 6 months' supply is a low inventory or sellers' market. Higher than 6 months' supply is a buyers' market as more homes than buyers are available.
This parameter is not a macro trend by itself, but it is reflective of all the factors that affect the demand/ supply through macro or localized effects, and as such, needs to be tracked for understanding which way home prices will go in the near or distant future.
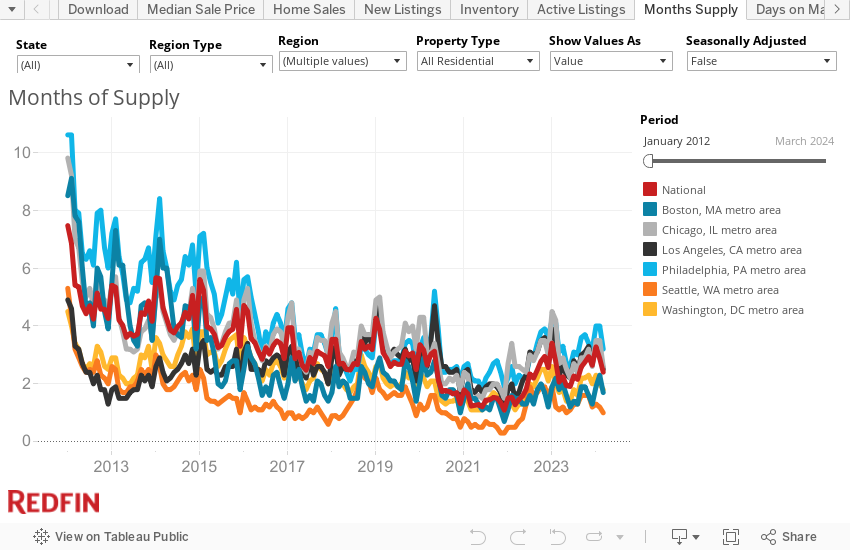
As is evident from the chart1 above , the trends across some of the major metropolitan cities are highly correlated, thus indicating the possibility of the same or similar factors influencing the overall trend in the market. From 2020 onwards, these trends need to be watched closely.
Population Migration from Cities to Suburbs and to Other States
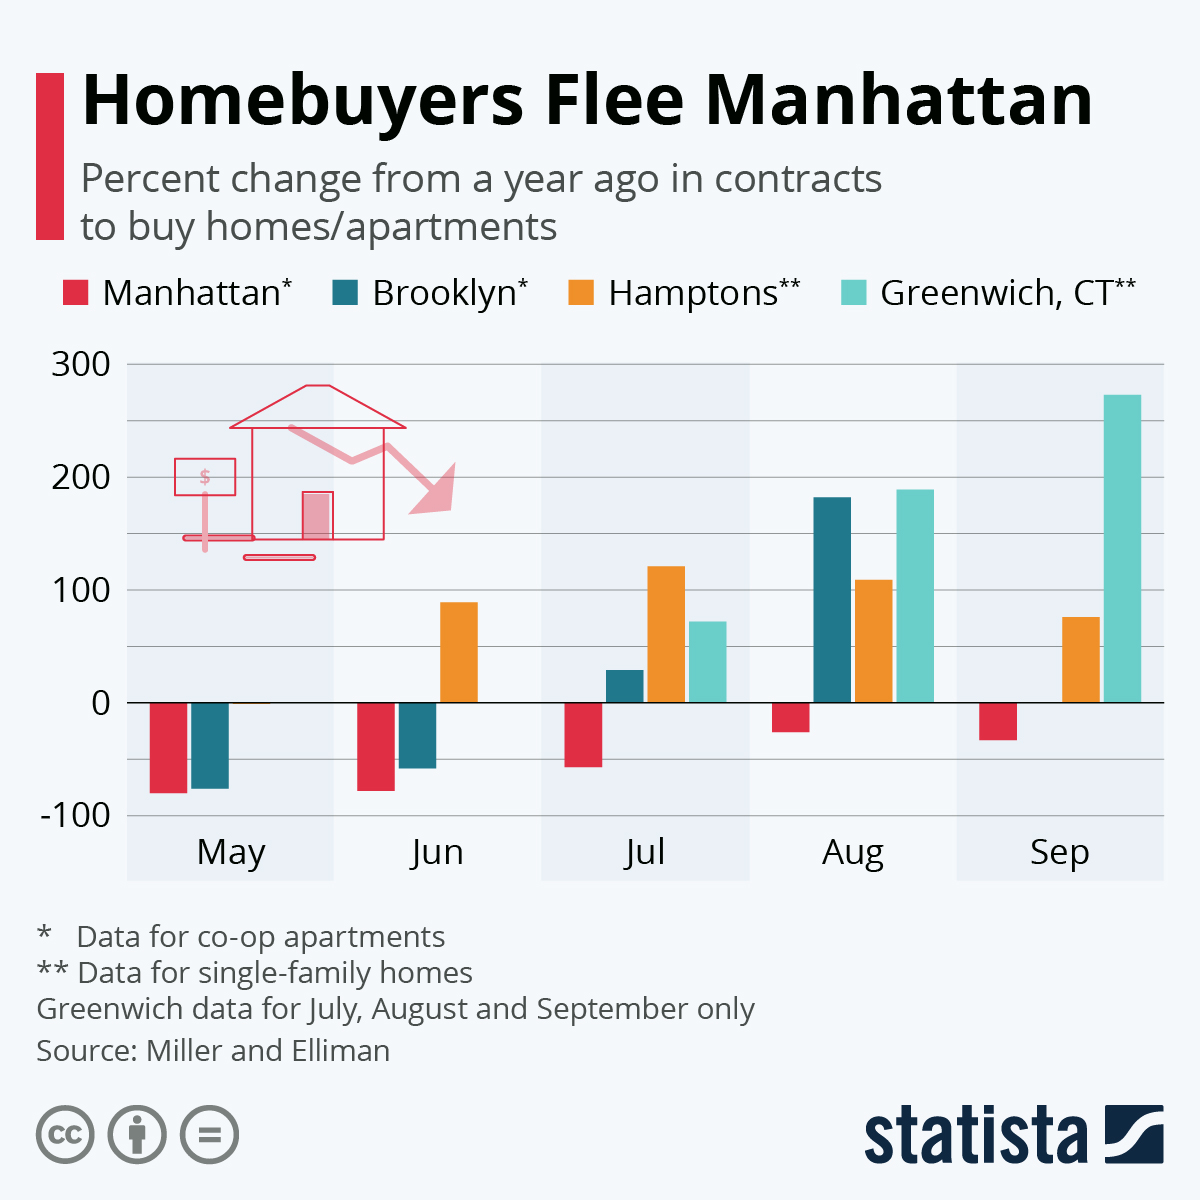
2020 has seen an unusual movement of people from cities to suburbs and from one state to another. This mass movement will certainly have a bearing on the housing market, the effects of which may be long lasting, as it is accompanied by a cultural shift towards remote work. Remote work means that people have the freedom to work from–and live–wherever they prefer to, rather than closer to the workplace.
So trends in the housing market in the big, expensive cities like New York City and San Francisco2 could be different from the national trend, and opposite of the trends in the suburbs and rural areas.
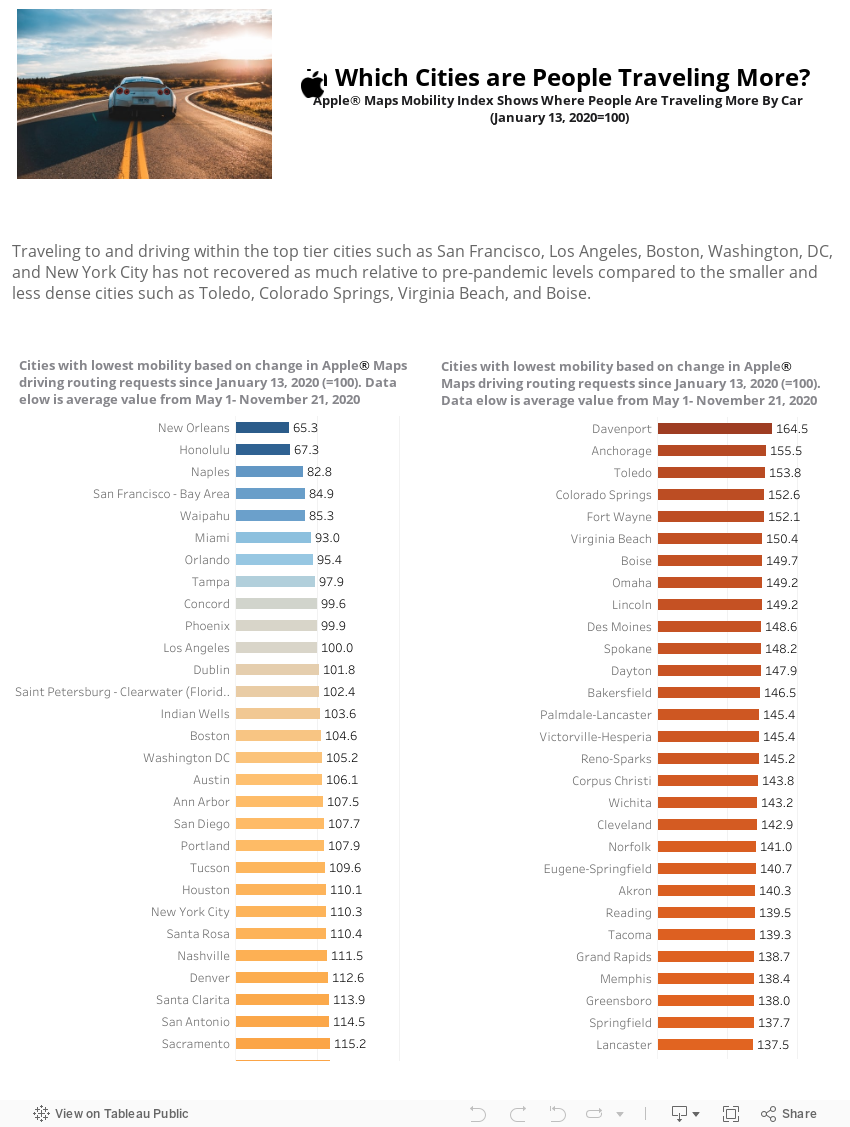
The chart3 above shows how mobility in US cities has changed this year, which is an indicator of changing work and commute patterns and population density. All of these will be deciding factors for the housing market.
 Infographic via Statista
Interest Rates
The prevailing interest rates affect the residential real estate market in more than one ways. They affect the cost of mortgage for a home buyer as well as the capital flows into the real estate market: these two factors tug at both demand and supply side of the equation. A breakdown of the ways in which interest rates affect the housing market is discussed below.
The Federal Reserve Monetary Policy
The Federal Reserve affects monetary policy in multiple ways, which affects the mortgage rates for buying homes. One of these policies is the 'Federal Funds Rate' which is an average of the short term interest rate at which US financial institutions lend money to each other.
The federal funds rate is the interest rate at which depository institutions trade federal funds (balances held at Federal Reserve Banks) with each other overnight.4
The Federal Reserve achieves the target Federal Funds Rate through monetary tools like bonds, which control the money supply into the system, changing the bank reserve requirements and the interest rates paid to banks on their reserve.

Chart via Statista
When the Federal Reserve wants to revive the economy, it takes measures to lower the Federal Funds Rate, to encourage spending by taking out mortgages. Since March 2020, the Federal Funds Rate has been set below 0.25%. The Federal Funds Rate affects the lending rates offered by banks on mortgages. Banks may, occasionally, choose to not pass on the benefit of low interest rates to customers, to prevent adverse selection of high risk defaulters. But with low Fed rates, there is a greater incentive to offer low mortgage rates to people.
The low mortgage rates available to buyers right now in part explains the short term boost in buying in the residential homes real estate market in many cities.
Lending Standards & Availability of Credit
Flexible lending standards and easy availability of credit makes it easier for buyers to purchase homes. Thus, as banks tighten their standards to give mortgages, demand for homes drops. Many people are unable to get the "prime" interest rate due to low credit ratings, and have to obtain a subprime mortgage for buying a house. Subprime loans are at a higher rate than the prime rate and vary with the person's credit score and the lender's standards. This changes the affordability range of a buyer considerably. At the same time, subprime loans have a more lax lending standard, and often a lower requirement for down payments, since they charge high rates, so they make it easier for high-risk individuals to obtain mortgages. It may influence a greater increase in demand for homes.
A growing percentage of people opt for converting mortgages which were earlier taken out at high rates to new mortgages through refinancing options, when the interest rates start to drop. The two charts above and below can explain this phenomenon. All of these are contributing factors on affordability of homes, thus influencing demand and pricing of residential homes.

Chart via Statista
Lending standards also include what %age of the price needs to be paid in down payments, and the availability of financing options for the down payment. When there are several buyers vying for the same property, the one who can make a bigger down payment and/or who can offer a higher price both matter in the final sale price and close of the deal.
Capital Flow
A low Federal Funds Rate usually means easier cash flow for banks and lower cost of capital. This alters how much capital flow is available to both: builders and buyers. Capital availability to builders makes it easier for them to build new properties, whereas capital availability to buyers makes it easier for them to buy houses. So, this plays into both the demand and supply side of the equation, and hence the effect is not linear. But it is an important factor in the housing market which must be tracked.
Health of the Economy
The overarching factor in deciding the pricing of any consumer good or service is, ofcourse, the health of the overall economy. Most of the factors discussed so far are also influenced by one or the other macroeconomic factor that decides the health of the economy. Below is a discussion of some of the most important factors that decide the health of the economy and influence house buying trends, and prices.
Inflation
An increase in the money supply propels an increase in the house prices due to inflation. The effect may or may not be offset by other operating factors, but inflation does have an impact on house prices. The Housing Price Index indicates the increase in house prices (taking a certain year as reference), whereas the Consumer Price Index indicates the increase in prices for all consumer goods.
Policy and Regulation/ De-regulation of the Market
The laws and policy around home ownership and sales differ from one state to another and one city to another. A strongly regulated housing market, with elaborate laws and rules, causes a longer time to close a deal. It can also act as a deterrent to buyers or result in loss of time and money in litigation. So any change in policy or laws which move the housing market towards more regulation can act to slow down the market and result in lower sales and longer time on market for properties.
In any given market, this will not be a main factor, as it will not affect the pricing of residential homes from one week or month to another, unless there is a change in policy, but it will be important when assessing the changes in the housing market overall during a population migration from one state or city to another. If it is more affordable and easier to buy a house in a different state or in the suburbs, more people will migrate out of the city and thus leave a chasm in the housing market of expensive cities.
Taxes
Tax rates alter the disposable income available to a buyer. If tax rates increase, it alters the affordable range of a buyer. While the tax rates remain the same for most part in any county or city, any alteration in tax rates can have a similar effect to change in policy and regulation of the market on a bigger scale.
Unemployment
Unemployment is the biggest marker of the state of the economy. As unemployment increases, tendency to buy property decreases. People are less likely to make huge or long term investments in a time when they are uncertain of the liquid cash available to them.
As in the chart above, there is somewhat of a correlation between the housing market and unemployment, though the causality could go either way, so there could be a lag either way. As unemployment (in %age) increases, the months of supply increases, indicating a weakening housing market. Conversely, the housing market could pick up due to other macroeconomic factors like Fed rates, affecting interest rates, leading to a decrease in unemployment as the economy overall gets revived.
Number of Bankruptcies Filed
Number of people going out of business works almost the same way as unemployment. It indicates the same type of phenomenon: a weak economy, but in a slightly different segment of people. Whereas unemployment usually indicates the total number of people who lost jobs, bankruptcies indicate people running their own businesses who closed their business due to losses and low future prospects. Whereas it may be relatively easier for someone to find a job, especially with efforts from government policy to revive the economy, shutting down a business is often accompanied with more long term financial problems and is likely to have a bigger impact on how likely people are to buy a house. In this scenario, people are more likely to sell houses to liquidate cash, or to refinance their mortgage, than to buy a house.
Both unemployment and bankruptcies increase the likelihood of increasing foreclosures, which can drastically bring down the pricing of homes for sale.
Sentiment Around Housing and Economy: Stock Market Sentiment Spillover
The overall sentiment around the economy is just as important a factor in purchasing decisions as the actual health of the economy itself. The real effects of the economy impact the housing market through changes in demand and supply in the market. But the sentiment around the economy affects the "Consumer Confidence," measured by the Consumer Confidence Index (CCI), which is a survey that records how optimistic or pessimistic consumers are about the future of the economy.
The chart5 shows how the CCI has varied historically.
"The Conference Board Consumer Confidence Index® declined in November, after remaining relatively flat in October. The Index now stands at 96.1 (1985=100), down from 101.4 (an upward revision) in October."6
The CCI is a measure of the general sentiment of the consumers and has a strong bearing on major buying decisions like buying a house. A lot of factors–like negative media reports, disturbing world events, threats of war, rising threat of the pandemic, violence and terrorism–all affect CCI and consumer behaviour.
Although there is no direct causal relationship established between the stock market and the housing market, there is a correlation between the two, and it is possible that the stock market affects the CCI, referred to as the "stock market spillover effect." Stock markets are often seen as an indicator of how robust prevailing economic conditions are. Hence, an upward swing in the stock market can boost optimism in consumers, influencing their intention to buy property.
Au contraire, the National Association of Home Builders’ monthly confidence index7 indicates the confidence evinced by home builders. It is measured as the NAHB/Wells Fargo Housing Market Index (HMI) which is evaluated via a survey of NAHB members on the market conditions for present sale of homes, sales expected in the next 6 months, and the traffic of prospective buyers. It can be referred to as the builders' confidence index since that is what it measures. This index has risen to 90 in November, showing optimism from builders. Tracking this index is also important, as it is a closer to the ground measure of the housing market.
Construction Costs
Construction costs have a direct relationship with the pricing of residential homes: an increase in construction costs increases the cost of building a home. It can also cause shifts from building new homes to selling old flipped homes or just selling existing property. Construction costs depend on a variety of factors, the main ones being availability of construction materials and skilled labour. Alteration in any trade policy that affects availability of an important construction material can cause delays in construction or hike in construction prices in the short term.

Cost of Living
Cost of living is in part covered by inflation, but it can also vary greatly from one city or town to another, and one state to another. It reduces the purchasing power of the same amount of money from one place to another. A trend of population migration could possibly be magnified by increased cost of living in expensive cities, and push the housing market to further slow down. Localized factors that cause an increase in cost of living, like energy costs, cost of commute, availability and cost of services etc would vary over time in the same city or neighbourhood, and will directly affect the housing market for that city or neighbourhood.
Infrastructure Development
Infrastructure development in a neighbourhood can considerably jack up the real estate prices in that neighbourhood–a new transit system, better roads and bridges, better public goods, proximity to schools, offices and colleges–all of these contribute to appreciating the price of residential property. Infrastructure development may happen slowly, or may happen at a fast pace (depending on availability of technology), but even the expectation and plans of infrastructure development can change the pricing trend in a neighbourhood. Although this is a more localized factor, a similar trend to build infrastructure in a state can change the housing market trends on a bigger scale as well.
Energy Price Shocks
Energy price shocks are suspected to have (atleast in part) contributed to the housing financial crisis of 2007-2008 and are a factor that must be closely monitored in the real estate market, especially in volatile market conditions like now.
Results suggest that unanticipated gasoline price shocks increase the cost of work commutes, lower the value of homes away from the city center, and increase foreclosure rates as homeowners either cannot afford mortgage payments amid elevated gas expenditures or seek to abandon underwater homes.8
It is estimated that gasoline prices disproportionately affected low-income suburban households, triggering a cycle of debt and default which led to the 2007 housing financial crisis. The increased prices also lowered the value of homes away from city centers. This dynamics may not play out the same way in the current times, due to the increasing cultural shift towards remote work, but nevertheless, it is a trend that should not be ignored.
Household Structure
The changing buying and living behaviour of people considerably alters the tendency to buy a house. For instance, in the last decade, a bigger percentage of US young adults are likely to live with their parents, lowering the tendency to buy a house for that age group.
The buying behaviour of families, mixed families and singles are all different, and as the household structure of a typical American household changes in a locality, city or the country overall, it has an impact on the housing market.
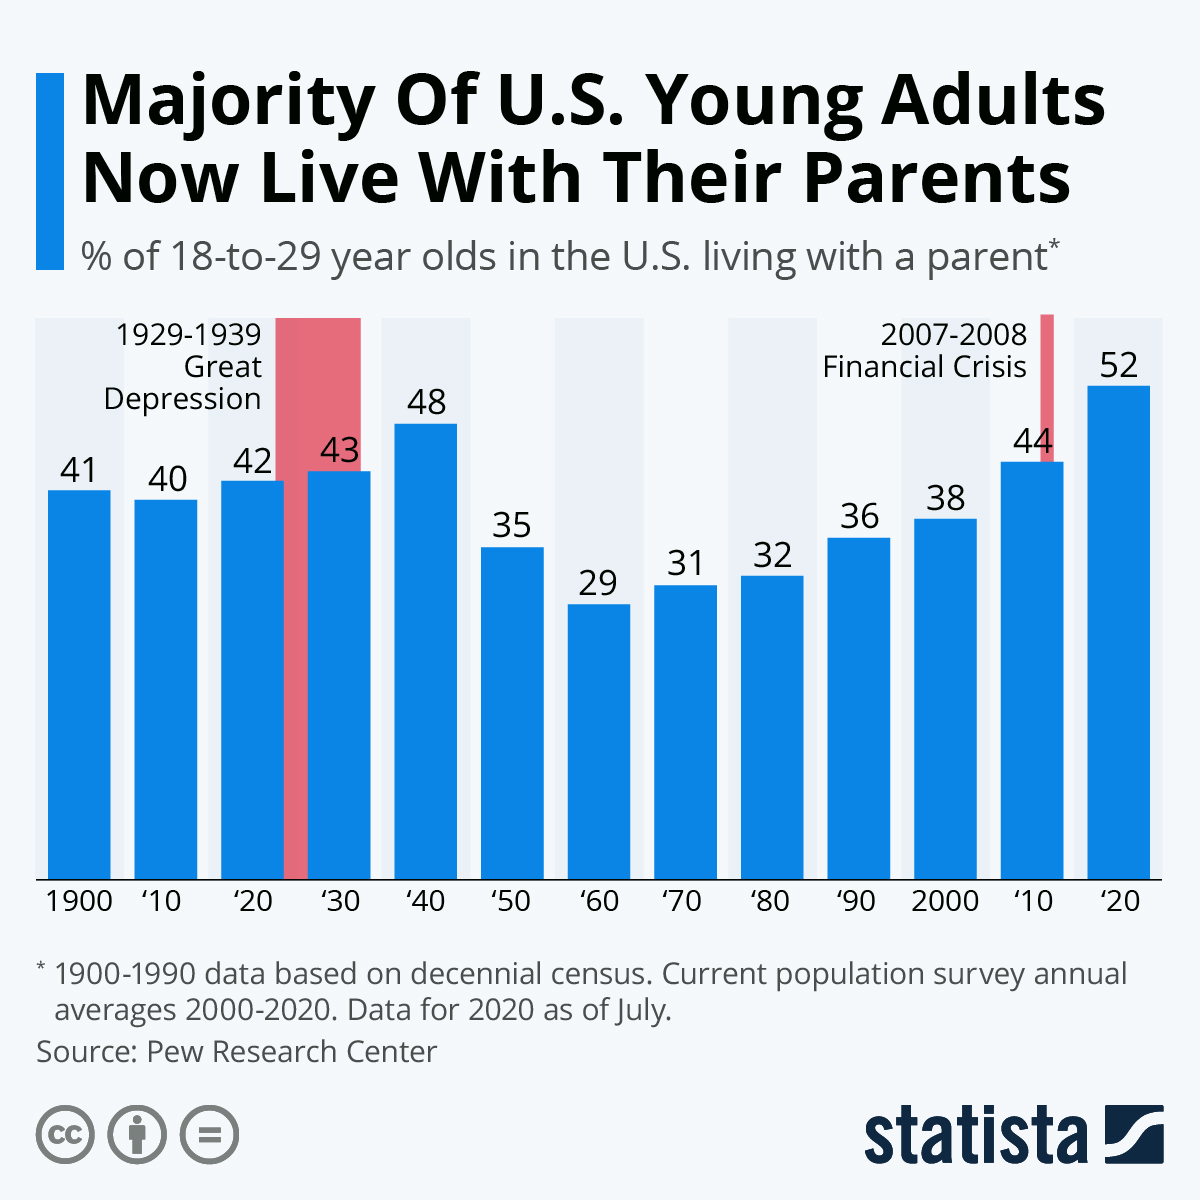 Infographic via Statista
Standards Deciding the Pricing of a Typical Home
Different components of a typical house influence its price, varying with the cost per unit of the component. These are factors that are not directly dependent on any macroeconomic factor, but their configuration would change with consumer preferences over a period of time. This Kaggle Dataset gives a breakdown of the typical components of a house. A price prediction model can be built using this or similar dataset for the required locality. What would, ideally, be required to be taken into account to make a futuristic prediction on home pricing, would be which features of a home are gaining more popularity, and hence, are likely to be a bigger factor in influencing the prices of homes in the coming months/years.
For example, the change of buyer preferences for different features of a home in San Francisco, like storage area, washer and dryer, stainless steel appliances etc, are indicators for how these features and their pricing and availability will affect home prices.
There are many micro- and macroeconomic factors that may still remain, which would play into predicting home prices, but most of the remaining factors are endogenous and affect the pricing through one or more of the variables already discussed. More such variables can be added, ofcourse, for the purpose of building a prediction model, but this list would give a practically complete understanding of what to look out for in the residential real estate market for USA in the next decade.
Photo by Binyamin Mellish from Pexels
References:
- Data provided by Redfin, a national real estate brokerage
- The 2020 San Francisco exodus is real, and historic, report shows
- More Homebuyers Purchasing Property in the Suburbs, Small Towns, or Rural Areas
- Board of Governors of the Federal Reserve System (US), Effective Federal Funds Rate [FEDFUNDS], retrieved from FRED, Federal Reserve Bank of St. Louis; https://fred.stlouisfed.org/series/FEDFUNDS, November 23, 2020.
- OECD (2020), Consumer confidence index (CCI) (indicator). doi: 10.1787/46434d78-en (Accessed on 25 November 2020).
- The Conference Board
- NAHB/Wells Fargo Housing Market Index (HMI)
- JunJie Wu, Steven Sexton, David Zilberman, Energy price shocks, Household location patterns and housing crises: Theory and implications, Energy Economics, Volume 80, 2019, Pages 691-706, ISSN 0140-9883, https://doi.org/10.1016/j.eneco.2019.01.021.